Share
Pepperjam Unveils Fascinating Affiliate Marketing Sales Index
Pepperjam is a longtime partner of ours here at Advertise Purple. And due to the longevity of our relationship, we consider any report they put out to be highly impactful, especially in the affiliate marketing world.
That said, I think most would agree that in these times, such a report means even more.
This is precisely why the Affiliate Marketing Sales Index they put out last week has, in the opinion of our account management and data teams, numerous key takeaways and insights that we will use going forward in developing our affiliate strategies for customers.
Because while we have a lot of great data at our disposal, looking from a higher level perspective sometimes makes it even easier to pay closer attention to the trends and general happenings in our constantly evolving industry.
So, let’s dive right into what we have learned thanks to Pepperjam.
What exactly went into the report?
According to Pepperjam:
“In developing the Pepperjam Affiliate Marketing Sales Index we measured the gross merchandise sales directly attributable to affiliate marketing promotions for the period beginning
March 1st through October 24th and compared them against the affiliate gross merchandise sales for the same period in 2019.
We analyzed performance in 10 retail categories comprised of ~700 retail brands as tracked in the Pepperjam AscendTM Affiliate Cloud Platform. Additionally, commission trends, publisher activity and customer behavior were also examined.”
How does this report compare to what we’ve found at Advertise Purple?
The great thing about looking at this kind of macro data is that it acts as confirmation that our reporting (which is strikingly similar) is also accurate. Many of the same trends that we’ve found in this report only further emphasize what we already knew.
However, it’s great to see and it is certainly useful when sorting through the many verticals and industries we work with on a daily basis.
So, what were the findings?
What exactly are the different tiers of verticals that we’re seeing right now either failing or succeeding?
Here’s a shot from the report which I wanted to include to properly illustrate what we’re seeing from the market:
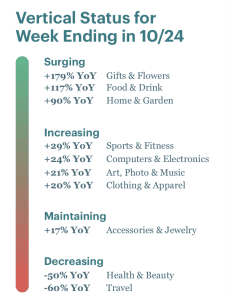
The elephant in the room, COVID, has heavily impacted those “decreasing” verticals of travel and health/beauty.
An interesting tidbit from our own data is that we actually aren’t seeing these decreases for our health and beauty customers. Rather, we’re seeing relatively consistent sales numbers. Just something to consider.
Also, travel restrictions have heavily impacted the industry but many travel executives are bullish on the return of the market in the near future.
Of course, a rebound and recovery phase is likely imminent so it’s not time to give up on those verticals in the future, especially if we develop some sort of vaccine for the virus.
What’s great to see is what’s surging: gifts & flowers, food & drink, and home & garden are all great examples of ways to spend to do the following:
Gifts & Flowers – allows us to demonstrate our appreciation and love for others, maybe on special occasions or just to show we care. Completely safe and socially distant.
Food & Drink – Let’s be honest, some of us have packed on a few in quarantine (speaking from personal experience). Food and drink help keep us all sane these days and there’s nothing wrong with that.
Home & Garden – Now that we’re all stuck at home, why wouldn’t it make sense to prioritize putting effort into making your surroundings idyllic and comfortable?
Front of the “increasing” column, it looks as if there’s also something you could take from Pepperjam’s report in our somewhat locked down quarantine period that seemingly may never end…
Sports & Fitness – again, this alludes to my point above about personal health and wellness during a pandemic. Our bodies aren’t used to this much time indoors. It’s even more important to focus on working out. Many Advertise Purple clients have benefitted from the “workout from home” push and we have customers who are doing quite well selling at home fitness/sports products and services.
Computers & Electronics – Work From Home likely is a big reason for an increase here. Additional monitors, tech products, speakers etc all help make that at-home office or leisure alike a little more tenable.
Art, Photo, and Music – Yet another one that makes a lot of sense. Hobbies and arts continue to keep us sane in these difficult times.
Clothing & Apparel – What’s interesting about this one is that we actually were seeing dips only a few months ago as nobody was “going out” onto the town or feeling the need to purchase clothing. However, with the softening of restrictions and good deals on clothes, we’ve seen a bump here too and it’s good to see Pepperjam does as well.
What we see that is “maintaining” is a vertical similar to clothing & apparel, although typically with a higher average order value.
Accessories & Jewelry – Again, with that higher AOV, it makes sense that this one is merely maintaining rather than growing rapidly. Although, I do expect a Q4 bump which is typical for jewelry around the holidays.
—
If you’d like a closer look at the Pepperjam report, you can download it here.
According to Pepperjam,
“Marketers are searching—more than ever—for guidance in a period of uncertainty as a result of Covid-19. Pepperjam wanted to leverage its position as a hub of ecommerce across 1000+ retail brands to provide data-driven recommendations and insights.
Download the Pepperjam Affiliate Marketing Sales Index for trend information that details the daily gross merchandise sales performance for same store sales across verticals year-over-year, and get the of-the-moment insights you need.”
Enjoy!